STEP FOUR
Put your diagram (i.e., your theoretical model) together
Putting your diagram together involves the following five steps:
STEP A
Start by putting each construct in a circle
A circle should be used instead of a rectangle because a rectangle has a different purpose. See below for Construct A, Construct B and Construct C, which we call Service Quality, Customer Loyalty and Trust.
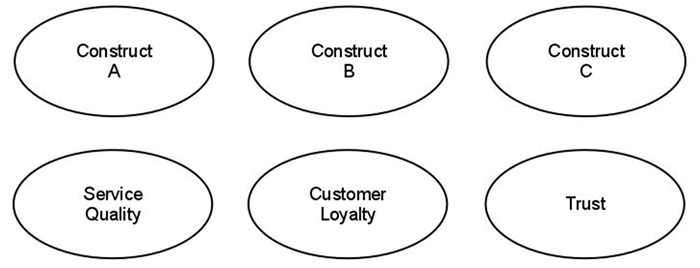
Note that most constructs will only be 1-3 words long (e.g., Trust, Service Quality or Customer Loyalty), but they can also be 4-6 words long (e.g., Trust in the Service Provider, Customer Disposition to Trust). Whilst they can be longer, it is important to try and keep the name of a construct short (i.e., precise), leaving the longer, operational definition of that construct to the main body of your Literature Review chapter.
STEP B
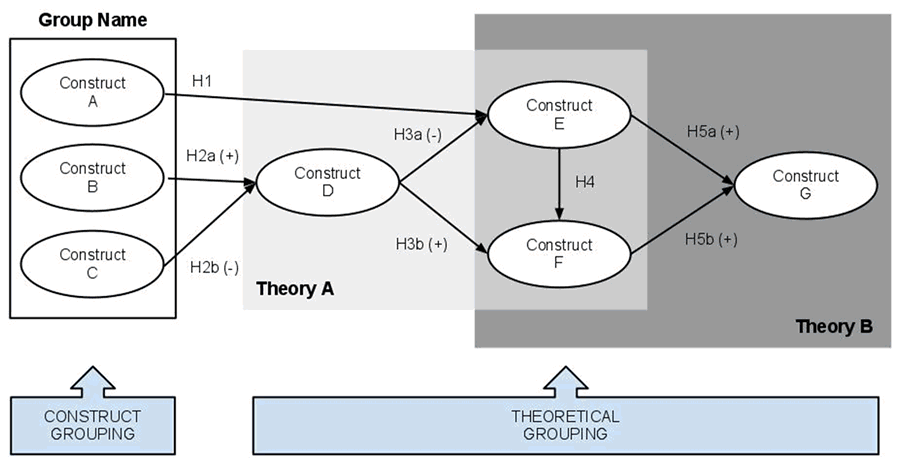
Based on your hypotheses...
Use thick line arrows (i.e., rather than dotted lined arrows) to show the relationships between your constructs.
Insert the number (and part, if any) of each hypothesis next to the relationships you are trying to show. Hypotheses are expressed as H, followed by the hypotheses number (e.g. H2), sometimes with multiple parts (e.g. H2a and H2b, or H2a and H2b).
If you have stated a research hypothesis in your dissertation (i.e., rather than a null hypothesis), which you probably will have done, and you have expressed the directionality (i.e., positive or negative) of this hypothesis, insert a positive (+) or negative (-) symbol on the right hand side of each hypothesis (e.g., H1a (+)).
If you are unsure about any of these terms, see the section on Research (and null) hypotheses in the Fundamentals part of Lærd Dissertation.
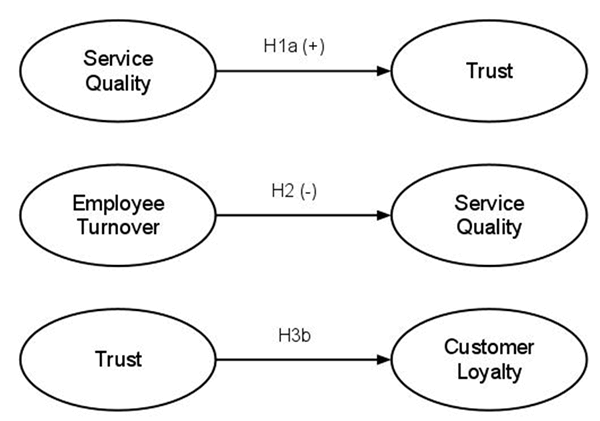
In the examples above, we have illustrated: (a) a positive relationship being predicted between service quality and trust (i.e., as service quality increases, trust increase); (b) a negative relationship being predicted between employee turnover and service quality (i.e., as employee turnover increases, service quality decreases); and (c) no relationship being predicted between trust and customer loyalty (i.e., we believe that there is a relationship between trust and customer loyalty, but we are unsure whether the relationship is positive or negative).
STEP C
If relevant, group constructs and highlight ties to theory:
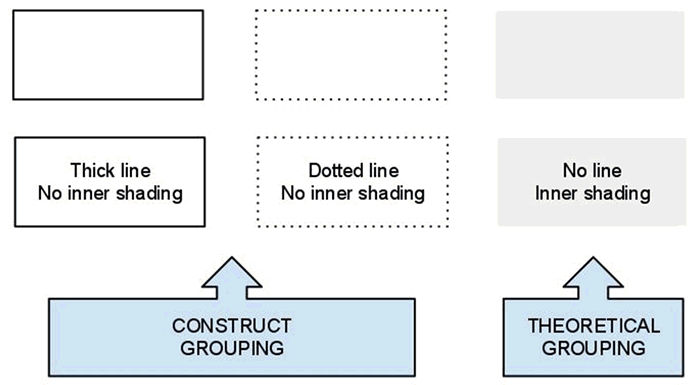
As previously mentioned in STEP THREE, sometimes constructs can be grouped (i.e., construct grouping) and the theories that underpin the relationships between them illustrated (i.e., theoretical group). We do highlighting construct grouping and theoretical grouping using different types of rectangles (see diagram below):
Construct grouping
We can show that constructs are related to each other in some way (e.g., the three dimensions of organisational commitment, namely affective, continuance and normative commitment) by enclosing these constructs (which we put in circles) in a rectangle. As you can see in the diagram below, these rectangles either have (a) a thick line with no inner shading or (b) a dotted line with no shading. We recommend using:
A thick line when the constructs are part of a broader, overarching construct
For example, the case of organisational commitment, since normative commitment, continuance commitment and affective commitment were part of the broader construct, organisational commitment (Meyer & Allen, 1991).
A dotted line when the constructs are more loosely coupled/tied by some other factor
For example, in a study looking at the construct, customer loyalty, you may be interested in number of constructs, such as service quality, trust, customer satisfaction, and so forth. However, you may also be interested in a customer's age, gender, income, educational background, and so forth. All of these latter constructs (i.e., age, gender, income, educational background, etc.) could be classified as individual characteristics. Therefore, we can enclose these constructs in a rectangle with a dotted line to show that they are loosely coupled/tied.
Theoretical grouping
When you are simply illustrating how different constructs are underpinned by certain theories, this can be shown by placing a rectangle, with inner shading, but no line, underneath the relevant constructs (which we put in circles).
When we want to show how theories and constructs may overlap, we can bring together two (or more) rectangles; again, rectangles with inner shading, but no line.
In both cases, it is helpful to use a different colour of inner shading for each of the different theories, especially when they overlap.
In either case, you should give the rectangle a name (e.g., Organisational Commitment in the first example, and Individual Characteristics in the second example).
STEP D
Try and order your constructs
With all the different construct, hypotheses, arrows, construct grouping, and maybe even theoretical grouping, it is difficult to avoid producing a diagram (i.e., a theoretical model) that is not very messy. A lot of this is trial and error, but one rule that you should try and stick to is to start with those constructs that are acting as independent variables on the left of the diagram, and those constructs acting as dependent variables on the right. Just as we read the page from left-to-right, we want the reader to quickly understand that we are examining the impact of those independent variables (also known as predictor variables) on the left, on the dependent variables (also known as outcomes variables) on the right. This is the same formula that we use when putting together quantitative research questions or hypotheses; again, because it helps the reader to understand what we are trying to study [see the articles: Quantitative research questions and Research (and null) hypotheses in the Fundamentals part of Lærd Dissertation].
STEP E
Put it all together and give it a suitable title
Once you've worked through STEPS A to D above, it is time to put your diagram together, and give the theoretical model you have created a suitable title. Below we illustrate an example model: